Setting the nuttiness of Donald Trump and his candidacy aside, the 2016 presidential campaign serves as a fitting reminder of America’s deepening partisan divide. Americans have not only grown more ideologically polarized over the past couple of decades, Republicans and Democrats are drawn to very different kind of places. Back in 2004, Bill Bishop dubbed the self-segregation of Americans into like-minded communities, “The Big Sort.” (My next post for CityLab will dig into how these differences are shaping the 2016 election results. So stay tuned!)
A recent study by Ron Johnston, David Manley, and Kelvyn Jones in Annals of American Association of Geographers takes a deep dive into the big sort in American politics, examining the past six presidential elections, from 1992 to 2012, spanning Bill Clinton to Barack Obama. While most research examines America’s partisan divide across states—Andrew Gelman’s book, Red State, Blue State, Rich State, Poor Statebeing perhaps the best example—this study does so across three different geographic levels or scales: nine broad Census divisions or regions, 50 states, and more than 3,000 counties.
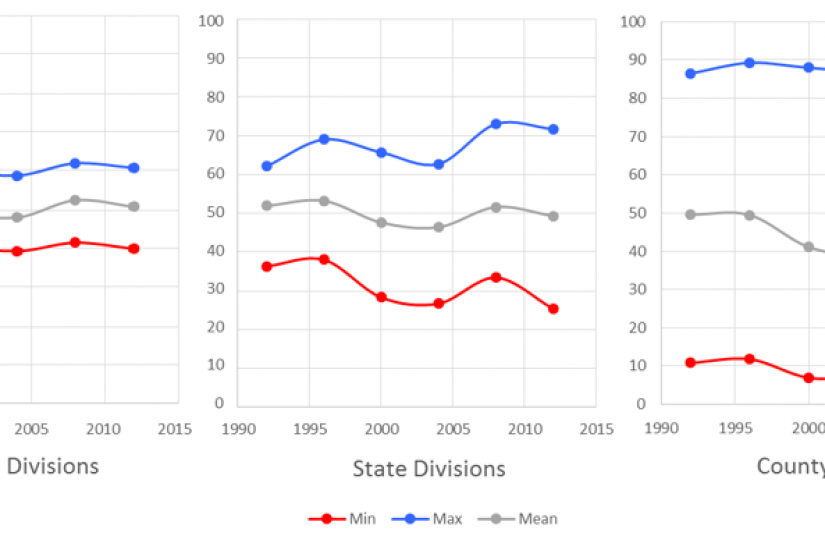
The chart above shows the distribution of votes for these divisions, states, and counties using the minimum, maximum, and average percentage of Democratic votes that each geographic level garnered. The takeaway is that there’s substantial evidence of a growing spatial polarization across all three. Aside from a blip in 1996, there’s been a general decline in the minimum number of Democratic voters and an increase in the maximum number of Democratic voters at each scale.
This pattern is even more amplified as the geographic scale gets smaller. In 1992, the gap between divisions with the least and greatest support for Democrats was ten percentage points. By 2012, the largest gap had grown to more than 20 percentage points. At the state level, it grew from 26 points to more than 46 points. And at the county level it expanded from 75 points to 90 points. In 2012, Democrats carried just 3.5 percent of votes in the minimum county and 94 percent of the votes in their maximum county.