One of the key insights of human geography is the observation that people arrange space according to the economic, social, and political conditions in which they live, and one of the key insights of historical geography is the observation that almost every built landscape preserves the structuring forces of decades and centuries past. These two observations are fairly easy to spot in a place like Massachusetts, where our current geographical arrangements are very often an obvious fusion of both past and present economic, social, and political orders. A row of expensive condominiums in Charlestown documents both the contemporary desire of well-heeled professionals to live near urban cultural amenities as well as the neighborhood typology of a long-obsolete shipbuilding industry. The racial and income gap between Lawrence and Andover runs along a line established in 1847 to divide the landscape of smallholder agriculture from the urban economy of a booming textile industry, both of which have almost entirely vanished in the present day.
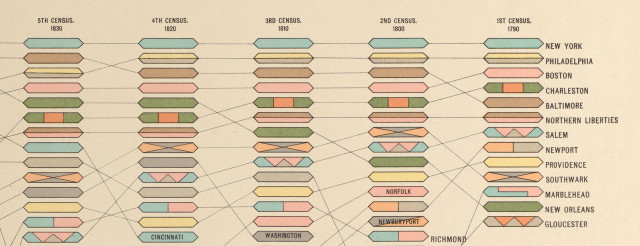
The stirring-together of past and present geographic arrangements is on display not only at the scale of buildings, neighborhoods, and towns, but in the overall structure of the state of Massachusetts as well. One of my favorite bits of trivia is the fact that Salem, Marblehead, and Gloucester were among the 13 largest cities in the United States at the time of the first census in 1790, and Nantucket was the 15th largest city in the nation in 1800. Those rankings, which seem so absurd today, are more than just an odd bit of trivia. They’re also a historical document of the profound orientation of the economic geography of the early United States towards the Atlantic. Patterns of what geographers call “urban hierarchy”—the size and relationship of cities within a national or international network—are a very useful document for diagramming the shape of a larger spatial order. For instance, in our 2019–2020 exhibition America Transformed, this graphic from the statistical atlas of the Eleventh Census helped tell the story of how the rise of Midwestern cities like Chicago and St. Louis reshaped the United States in the late nineteenth century.