How does one visualize history and chart time? Is it a line, moving forever outward in one direction? A Grecian temple, as Emma Willard envisioned, with Ionic columns representing centuries, receding from view toward a vanishing point at the world’s origin? Or could it be a corkscrew ascending upward, allowing us to look down from our present position into past events similar to our own?
For the Polish educator Antoni Jażwiński, history was best represented by an abstract grid — or at least it was for the purposes of remembering it. The so-called “Polish System” originated in the 1820s and was later brought to public attention in the 1830s and 1840s by General Józef Bem, a military engineer with a penchant for mnemonics. As Anthony Grafton and Daniel Rosenberg catalogue in their Cartographies of Time, the nineteenth century brimmed with new methods and technologies for committing historical information to memory — and Jażwiński’s contribution (and its later adaptations) proved one of the most popular.
The Polish System — which almost anticipates Piet Mondrian’s abstract checkerboards and the wider modernist fascination with grid figures — coupled chronology to the map-making traditions of geography. In Jażwiński’s original chart, each main 10x10 box is a century and the rows separate decades. Within a century box, each individual square is a year, each color a nation (with shading for different monarchs or governments), and symbols can stand for marriages, wars, treaties, and other types of events. Should one become proficient with this system, they can peer down on the history of the world, summarized on a surface not much larger than a chessboard.

In this detail from the above table (showing the years 1751 to 1800), “Corse” appears in the square representing 1769, denoting the French conquest of Corsica; “21 jan” is written over the 1793 square, denoting the execution of Louis XVI (whose reign is shown in the deeper shade of orange) — Source.
In addition to the colored grid, Jażwiński also explored other ways of making events easy to remember within the gridded matrix. One of the most striking of these was the idea of “chronological constellations”, laid out in part two of his Méthode polonaise (1835). Here historical events marked in the grid would become guiding points within a larger shape, as stars function in a heavenly constellation — “sometimes it's a chair, a sickle, a boat, a letter of the alphabet, etc.”
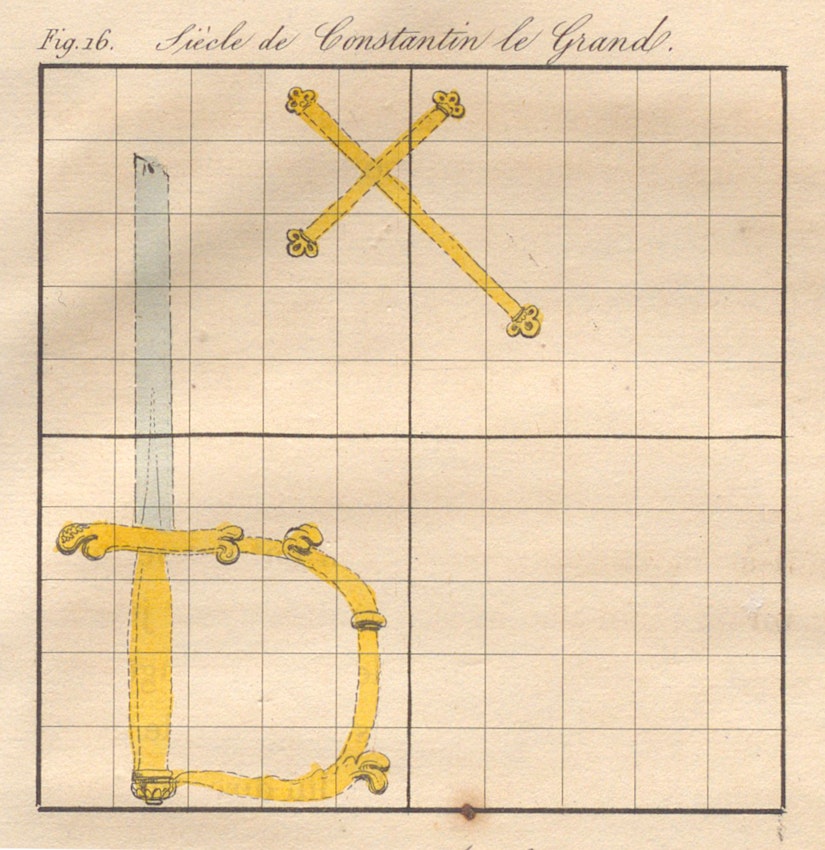
Illustration of a “chronological constellation” from "the century of Constantine the Great", from Antoni Jażwiński's Méthode polonaise (1835).