
These eye-catching maps, drawn by Harold Fisk — a geologist and cartographer working for the US Army Corps of Engineers — trace the ever-shifting banks of the Mississippi River from southern Illinois to southern Louisiana. Created to illustrate a rather dry government report on “the nature and origin of the Alluvial Valley of the Lower Mississippi River”, these cartographic marvels give even the untrained a very good sense of what the report calls the “stages in the development” and the present “behavior” of the river system. To put it in plainer English: Fisk dreamed up a captivating, colorful, visually succinct way of representing the Mississippi’s fluctuations through both space and time.
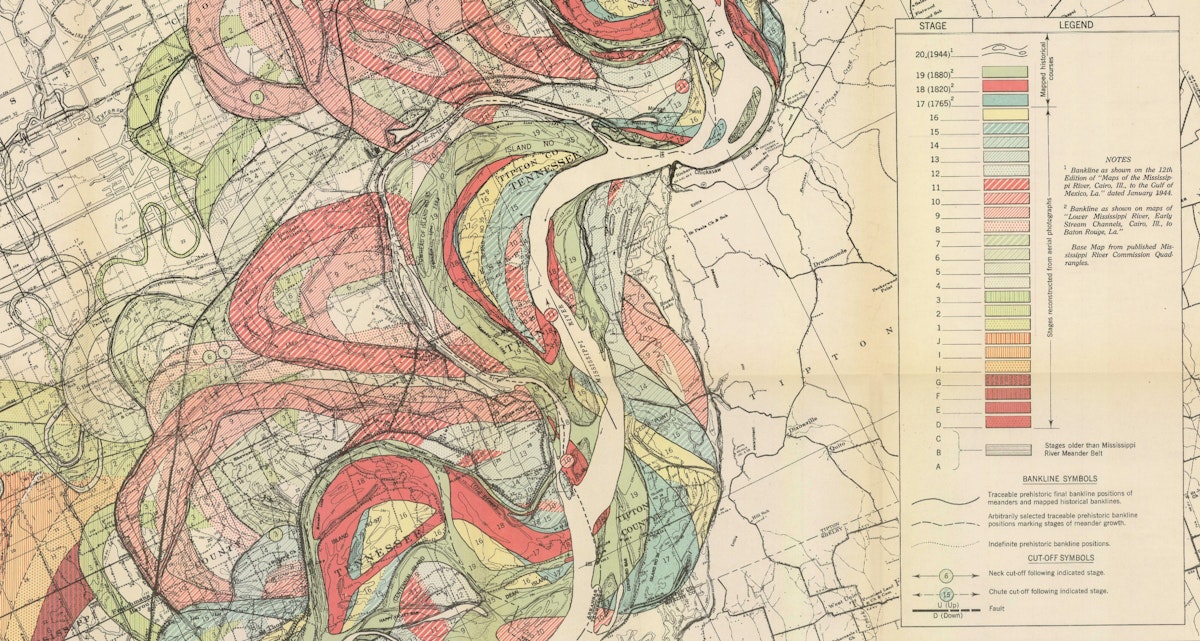
Technically speaking, all of these maps represent the lower Mississippi’s “meander belt” — the area of a valley bottom across which the river’s channel has shifted over the millennia. The meander belt of the Mississippi — which has the third largest watershed in the world — is immense. To represent all the water’s many shifts within this belt, Fisk hit on the brilliant idea of using overlapping colors. The current course of the river (current, that is, in 1944) is represented by a mighty blank, punctuated by islands, and crisscrossed by the serpentine green course of 1880, the salmon-pink course of 1820, and the light blue course of 1765. In addition to these relatively recent courses, one can see the color-coded traces of where the river flowed even earlier — a writhing palimpsest of meanders stretching back to prehistoric times.
To recreate the course of the river during the eighteenth and nineteenth centuries, Fisk drew on three historical maps (including Lieutenant Ross' influential charting from 1765). For earlier, pre-map eras, Fisk relied on aerial photography and geological study of the terrain, creating a truly extraordinary picture of the Mississippi’s long, deep history.
The blogger Jason Kottke beautifully evokes how these maps visualize the river’s long history, representing
thousands of years of course changes compressed into a single image by a clever mapmaker with an artistic eye. Looking at them, you're invited to imagine the Mississippi as it was during the European exploration of the Americas in the 1500s, during the Cahokia civilization in the 1200s (when this city's population matched London's), when the first humans came upon the river more than 12,000 years ago, and even back to before humans, when mammoths, camels, dire wolves, and giant beavers roamed the land and gazed upon the river.


