In the 1930s the federal government created redlining maps for almost every major American city. Mapping Inequality lets you explore these maps and the history of racial and ethnic discrimination in housing policy.
Redlining was the practice of categorically denying access to mortgages not just to individuals but to whole neighborhoods.
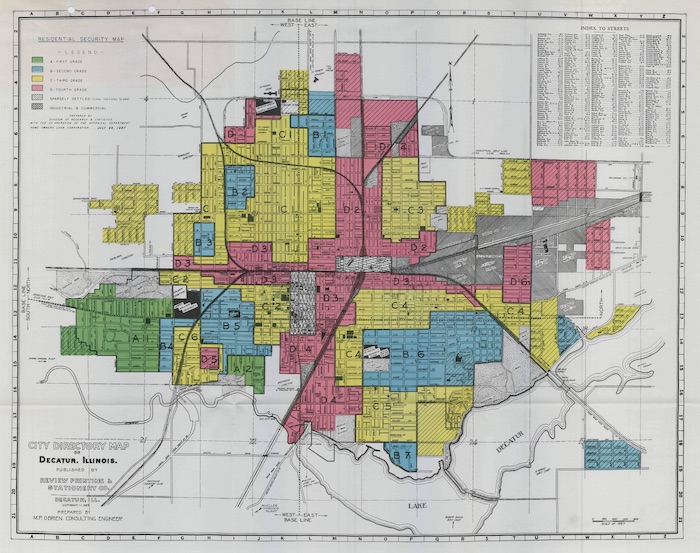
Between 1935 and 1940, an agency of the federal government, the Home Owners' Loan Corporation, graded the "residential security" of thousands of American neighborhoods. By "security," they meant the relative security or riskiness of those areas for banks, saving and loans, and other lenders who made mortgages.
For each of these cities, they produced maps showing those grades. Neighborhoods they deemed "best" and safe investments were given a grade of A and colored green. Those that were deemed "hazardous" were given a grade of "D" and colored red.
In most cases they also generated an "area description" for each of these neighborhoods providing descriptions of the houses, the sales and rental history, and of the residents.
If those residents were African Americans or, to a lesser extent, immigrants or Jews, HOLC deemed them a threat to the stability of home values and described their presence as an "infiltration."
Redlining was legal and practiced for decades. It dramatically affected the relative wealth—as well as the health—of different racial groups in America. Its impact is still with us today.
Introduction
By Robert K. Nelson
Among the thousands of area descriptions created by agents of the federal government's Home Owners' Loan Corporation between 1935 and 1940, the one that was written for what is now called the Carver Heights neighborhood in Savannah, Georgia, stands out. HOLC staff members, working with local real estate professionals in each city—lenders, developers, and real estate appraisers—assigned grades to residential neighborhoods that reflected their "mortgage security" that would then be visualized on color-coded maps. Neighborhoods receiving the highest grade of "A," colored green on the maps, were deemed minimal risks for banks and other mortgage lenders when they were determining who should receive loans and which areas in the city were safe investments. Those receiving the lowest grade of "D," colored red, were considered "hazardous." Conservative, responsible lenders, in HOLC judgment, would "refuse to make loans in these areas [or] only on a conservative basis." HOLC created area descriptions to help to organize the data they used to assign the grades. Among that information was the neighborhood's quality of housing, the recent history of sale and rent values, and, crucially, the racial and ethnic identity and class of residents.
The Savannah real estate professionals working with HOLC described the residents of Carver Heights as "a fair class of negroes and low type of white."Originally, they assigned a grade of "D" to Carver Heights. But their "consensus of opinion later changed," and they decided to assign it a "C." The change of grade followed from a change of perspective. They made an effort to not just see the neighborhood from their viewpoint as white men. "In other words," they explained in the neighborhood's area description, "it was considered from a negro standpoint of home ownership, rather than a white, since there are more negroes than whites in the neighborhood."
In none of the other cities surveyed by HOLC—more than 200 of them—is there any evidence of a comparable effort to consider a "negro standpoint." Quite the contrary. HOLC's field agents and the real estate professionals insisted that the residency of African Americans and immigrants, and to a lesser extent that of working-class whites, compromised the values of homes and the security of mortgages. In this they followed the guidelines set forth by Frederick Babcock, the central figure in early twentieth-century real estate appraisal standards, in his Underwriting Manual: "The infiltration of inharmonious racial groups," Babock proclaimed, "tend to lower the levels of land values and to lessen the desirability of residential areas."
As you explore the maps and search the area descriptions in Mapping Inequality, you will quickly encounter exactly that kind of language, descriptions of the "infiltration" of what were quite often described as "subversive," "undesirable," or "inharmonious," populations, for they are everywhere in the HOLC archive. Of the Mansion Flats neighborhood in Sacramento for instance, where "Italians predominate but with a Sprinkling of Mexicans, Negroes, and Orientals," HOLC pronounced that "the subversive character of the population constitutes the area's principal hazard. The area is accorded a 'medial red' grade."